Designed around graph topics students actually meet
A Level Maths and Further Maths specifications expect students to use graphs for algebra, functions, coordinate geometry, calculus, numerical methods, polar coordinates, vectors and modelling. Graphiti supports those topics by making the important features visible while students work.
- Plot explicit functions such as polynomials, trigonometric functions, exponentials and logarithms.
- Graph rational functions and inspect vertical, horizontal, oblique and curvilinear asymptotes.
- Use implicit plotting for circles, ellipses, hyperbolas and other conics.
- Explore parametric equations such as ellipses, loops and Lissajous-style curves.
- Plot polar graphs, including rose curves, limacons, spirals and polar rays.
Rational functions, asymptotes and curve sketching
Rational functions are a natural place to connect algebraic manipulation with graph behaviour. Graphiti can show the curve while also detecting asymptotes, holes and other features for suitable functions, so students can compare what they found algebraically with what the graph reveals.
Examples such as \(y = \frac{x + 2}{x - 1}\), \(y = \frac{x^2 + 1}{x - 2}\) and \(y = x^2 + \frac{1}{x}\) are useful for discussing domain restrictions, limiting behaviour, transformations and why an asymptote is a statement about behaviour rather than simply a line drawn on a picture.
Conics, implicit equations and Further Maths structure
Many important curves are not best introduced as a single explicit function. Graphiti's implicit equation plotting makes it practical to show circles, ellipses, hyperbolas and relations with several branches without first rearranging everything into separate parts.
That is helpful when teaching coordinate geometry and Further Maths topics where students need to recognise the form of a curve, interpret transformations, compare asymptotes, or understand why a relation can have vertical parts that a simple function plotter may miss.
Polar and parametric graphs
Polar and parametric curves are easier to teach when students can see how a parameter traces the curve. Graphiti includes polar range controls, optional negative \(r\) plotting and polar animation, alongside parametric plotting for curves defined by \(x(t)\) and \(y(t)\).
These tools support examples such as \(r = 2\cos(3\theta)\), \(r = 1 + \cos(\theta)\) and \((x, y) = (\cos t, \sin t)\). Students can move from the symbolic equation to the curve, then back to the meaning of the parameter.
Teaching, revision and classroom materials
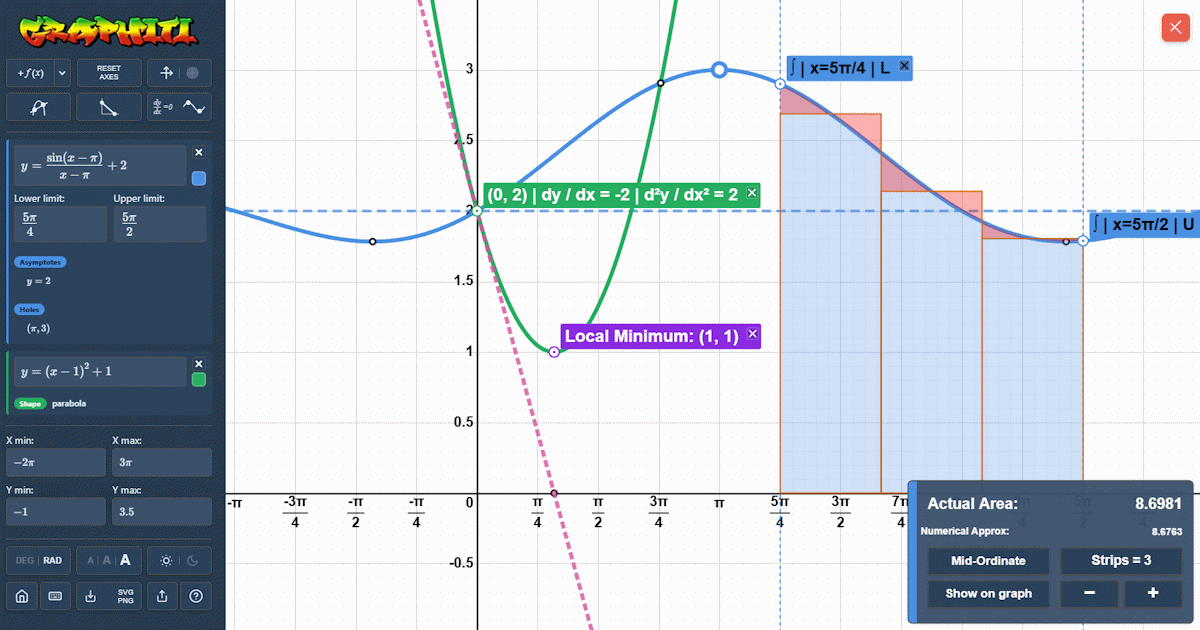
Graphiti can be used live in lessons, by students during independent revision, or by teachers preparing diagrams for worksheets and slides. It supports pan and zoom, trace markers, tangents, normals, intersections, integral regions and numerical integration visuals.
Exports are available as PNG or SVG, so a graph can move from an interactive classroom demonstration into a printed worksheet or a clean vector diagram. The aim is to support explanation without hiding the mathematics behind a black-box plotting result.