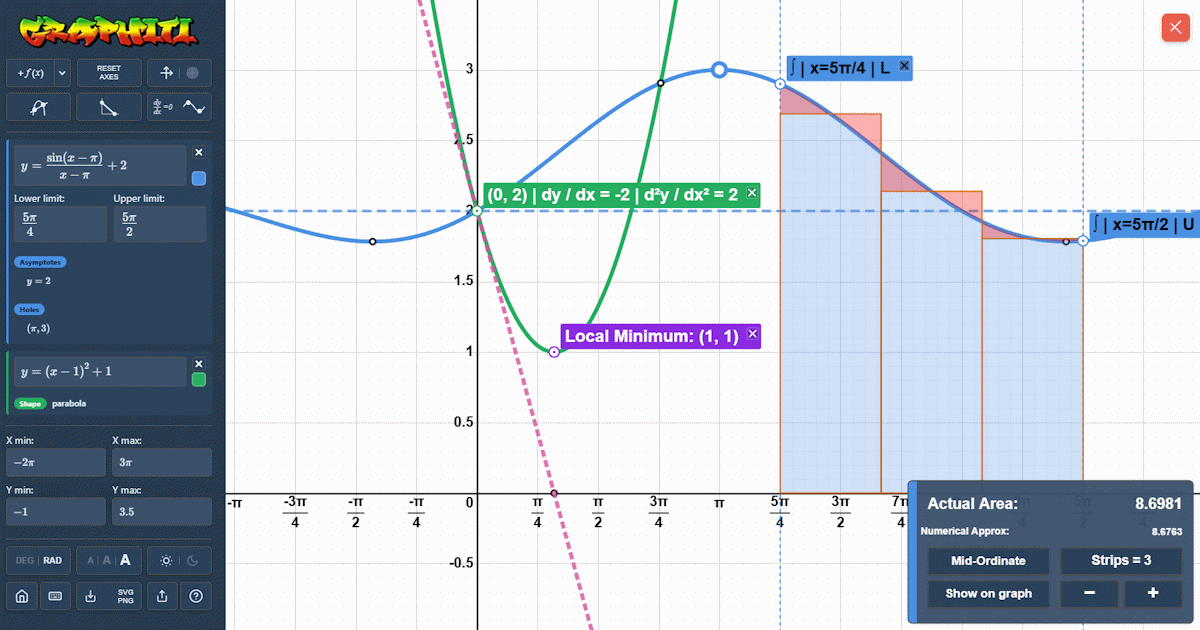
Automatic graph analysis
Automatic asymptote detection
Graphiti can automatically identify several important asymptotic features, including vertical, horizontal, oblique and curvilinear asymptotes, as well as related removable singularities and envelopes for suitable functions.
This supports curve sketching, visual explanation and classroom demonstration by linking plotted behaviour directly to asymptote equations. While some graphing tools include partial support for straight-line asymptotes, automatic detection presented this clearly is still relatively uncommon, and curvilinear asymptote detection is rarer still.
Automatic curve identification
Graphiti can classify many recognised curve types and shapes, including circles, ellipses, parabolas, hyperbolas, semi-cubical parabolas, folium of Descartes families and named polar curves (including lemniscates of Bernoulli) when their equations match supported forms.
It can also identify multiple components in supported implicit product equations, helping students and teachers interpret complex curve structure quickly. Automatic curve naming inside a graphing calculator is still rare, which makes this especially useful for teaching and revision.
Tangents and normals
You can place trace markers on curves and cycle them through tangent, normal and integral modes. Tangent and normal lines are useful when exploring gradients, differentiation and local behaviour.
Once added, tangents and normals can be dragged along curves while their badges show coordinates and first and second derivative values. When a tangent is placed at a turning point or point of inflection, the badge also indicates the detected type.
Area and integration
Graphiti can shade and calculate definite integral regions and area between curves. It also includes visual numerical integration methods such as the trapezium rule, Simpson's rule and the mid-ordinate rule.
Plotting tools
Explicit functions
Graphiti can plot familiar explicit functions such as y = x2, y = sin(x) and y = 1 / x, using standard mathematical notation.
It is useful for quickly comparing curves, zooming into local behaviour and building examples where students can see how changing an expression changes the graph.
Implicit equations
Graphiti can act as an implicit equation plotter for equations involving both x and y. This is useful for circles, ellipses, curves with vertical parts, and equations where solving explicitly for y would be awkward.
Examples include equations such as x2 + y2 = 25 and more unusual relations with singularities or multiple branches.
Inequality graphing
Graphiti supports explicit and implicit inequalities, including shaded regions, strict and non-strict boundaries, and intersections between multiple inequalities.
This makes it useful for visualising feasible regions, comparing inequality constraints and showing how boundary curves relate to shaded solution sets.
Polar curves
Graphiti can plot explicit and implicit polar curves, as well as polar rays. Polar mode includes controls for theta ranges, optional negative r plotting, and animation controls for stepping through how a polar curve is drawn, with curve identification support for roses, limacons, cardioids, lemniscates of Bernoulli, logarithmic spirals, hyperbolic spirals, Fermat spirals, lituus, conchoid of Nicomedes and sinusoidal spirals.
Examples include forms such as r = 1 + cos(θ) and implicit relations such as r - θ/r = 0.
This makes polar graphs easier to demonstrate in class, because students can see the curve build up as theta changes rather than only seeing the finished shape.
Parametric curves
Graphiti can plot parametric equations where x and y are both defined in terms of a parameter such as t. This is useful for ellipses, loops, Lissajous curves and curves that are awkward to write as a single explicit function.
Parametric plotting helps students see how the x and y components work together to trace a curve, which is useful in A-Level Maths and Further Maths examples.
Teaching and practical use
GCSE and A-Level maths
Graphiti is designed with GCSE, A-Level and classroom explanation in mind. It can support topics such as curve sketching, transformations, differentiation, integration, inequalities, numerical methods, parametric equations and polar graphs.
It can also help students see why features such as asymptotes, stationary points, holes and intersections matter.
Access, devices and offline use
Graphiti is free to use in the browser on desktop, tablet and mobile devices. It includes touch controls for panning, zooming and interacting with curves.
On supported devices, Graphiti can also be installed as a Progressive Web App. Once it has loaded and cached its files, it can continue to open and work without a network connection, which is useful in classrooms, on journeys, or anywhere you want to avoid using mobile data.
On iPhone and iPad, open Graphiti in Safari, tap the Share button, then choose Add to Home Screen. When launched from the home screen, Graphiti runs in a true full screen app view on iOS, which gives more room for the graph and avoids the usual browser controls.
On Android, supported browsers such as Chrome may show an install prompt, and installation is usually also available from the browser menu. On desktop browsers, there is often an install icon in the address bar for compatible Progressive Web Apps.
Sharing lesson examples and exports
You can share complete graph setups by URL, including functions, viewport and analysis markers. This is useful for sending examples to students, preparing revision tasks or returning to a saved exploration later.
Graphs can also be exported as PNG or SVG for worksheets, slides and documents. SVG output remains crisp and editable in many design and office tools.
Optional cloud saves
Graphiti works fully without an account. If you want to pick up your work on another device, you can optionally sign in with Google using the cloud icon and save graphs to your own account. Saved graphs can be opened, renamed and deleted from the same dialog, and you can keep up to 100.
Cloud saves are handy for teachers moving between a classroom computer, a laptop and a phone. For sharing with a whole class, URL sharing and exports still need no account at all. On a shared or school computer, use Sign out in the cloud dialog when you finish.
How Graphiti differs from other graphing tools
Desmos and GeoGebra are excellent graphing tools. Graphiti has a different emphasis: visual curve exploration, automatic graph analysis, calculus annotations, SVG export and shareable classroom setups.
It is especially useful when you want a graphing calculator that can show structure as well as shape.