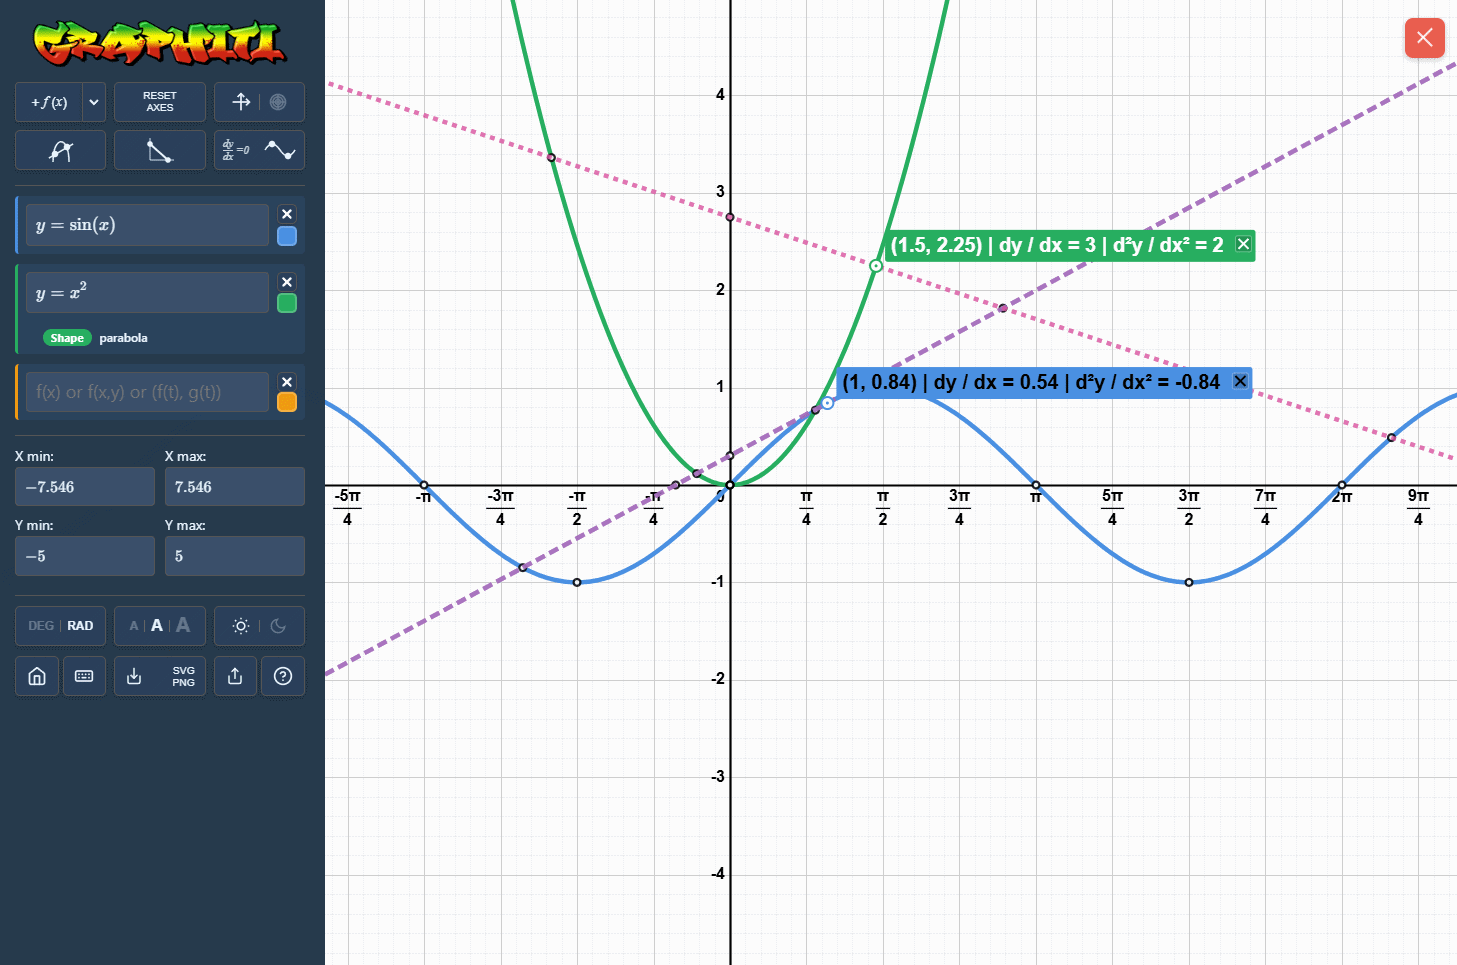
How to add and cycle markers
You can build up tangent and normal markers directly from the curve with repeated clicks on the same point.
- Click on a curve to add a coordinate badge.
- Click the badge again to turn it into a tangent marker.
- Click the badge again to turn it into a normal marker.
Repeat this on any other point of the same or different curves to add further interactive markers.
Drag markers for live derivative feedback
Once a tangent or normal is added, drag it along the curve to update its values in real time. The badge follows the marker and updates continuously as you move.
- Coordinate readout for the selected point.
- First derivative value for local gradient behaviour.
- Second derivative value for concavity and classification work.
Classroom calculus use
The tangent badge helps when teaching turning point detection and classification, as well as points of inflection. When the marker is positioned on a detected turning point or inflection, the badge also indicates the recognised type.
This makes live board demonstrations clearer because students can see geometry and derivative values together while the marker is dragged.