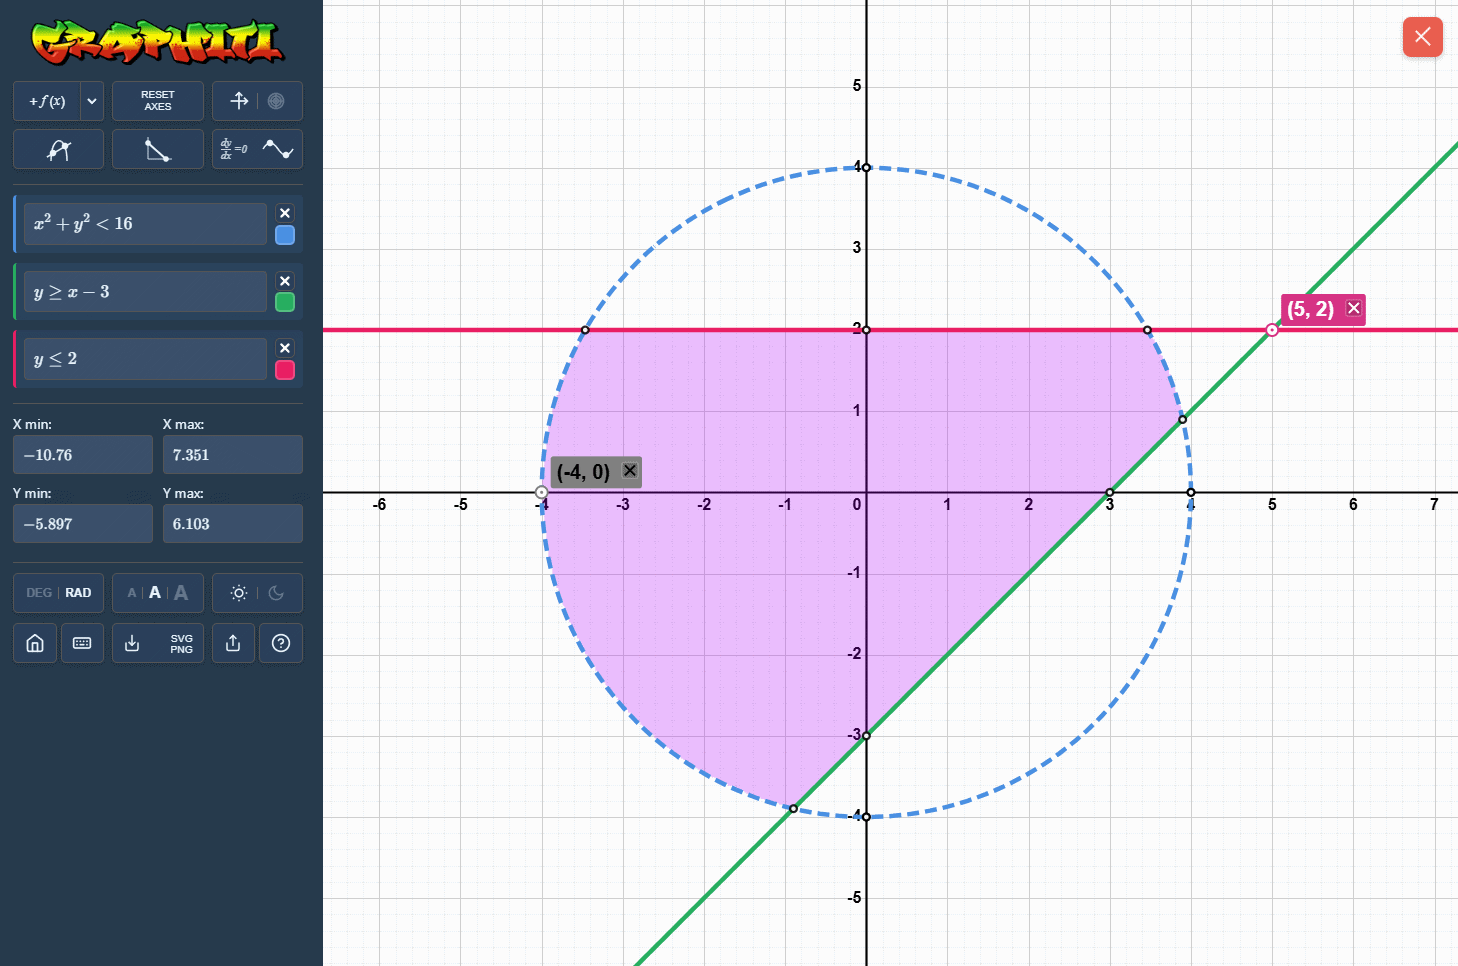
Shaded solution regions
Inequalities are plotted as shaded regions, so the solution set is visible at a glance. This helps students connect algebraic constraints with the part of the coordinate plane that satisfies them.
- Graph single inequalities and systems of inequalities.
- Show intersections between several shaded regions.
- Support strict and non-strict boundaries.
Explicit and implicit boundaries
Graphiti can handle familiar straight-line inequalities and implicit inequalities such as circles. That makes it useful for feasible regions, circle constraints, and examples where several boundary types appear together.
Classroom examples
Shared inequality setups can be opened directly from a URL, which makes them easy to use in lesson notes, revision tasks and worked examples.