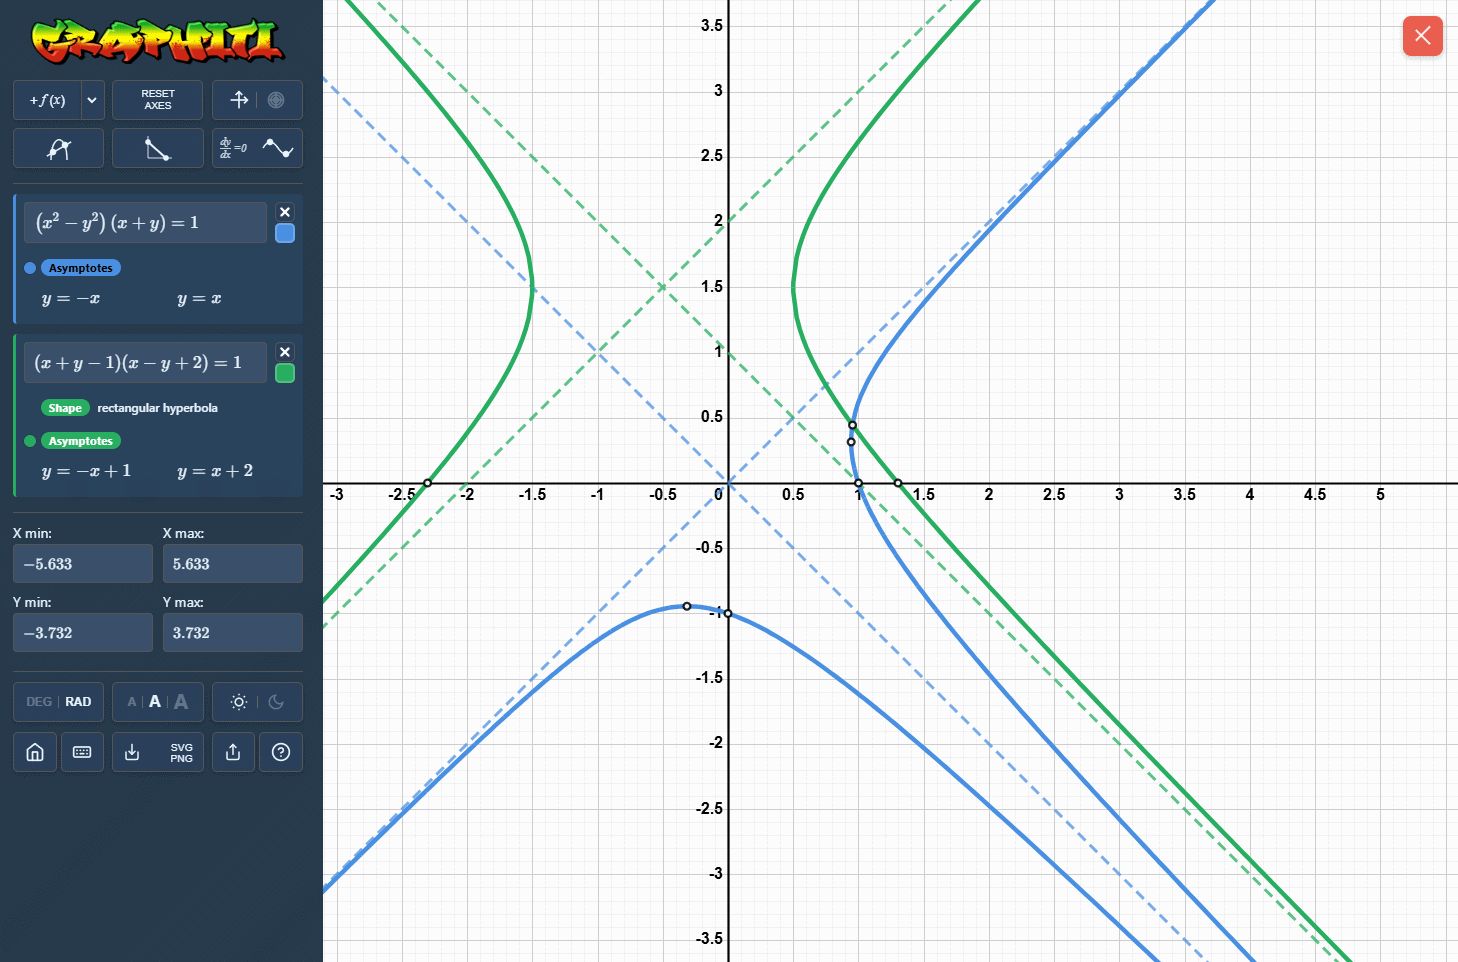
What Graphiti detects
When a suitable function is plotted, Graphiti analyses the graph and identifies asymptotic behaviour automatically. It can display the asymptote equations in the panel under the function so they can be used for explanation, checking or revision.
- Vertical asymptotes such as \(x = a\).
- Horizontal asymptotes such as \(y = b\).
- Oblique asymptotes such as \(y = mx + c\).
- Curvilinear asymptotes where the graph approaches another curve.
- Asymptotes for many functions used in A-Level Maths and Further Maths examples.
Why it helps
Asymptotes are easy to miss when students only see a plotted curve. Showing the equations alongside the graph makes it clearer how limits, transformations and algebraic structure affect the behaviour of the function.
This is useful for curve sketching, checking algebraic answers, comparing transformed functions and demonstrating why a graph gets close to a line or curve without meeting it in the expected region.