What polar plotting adds
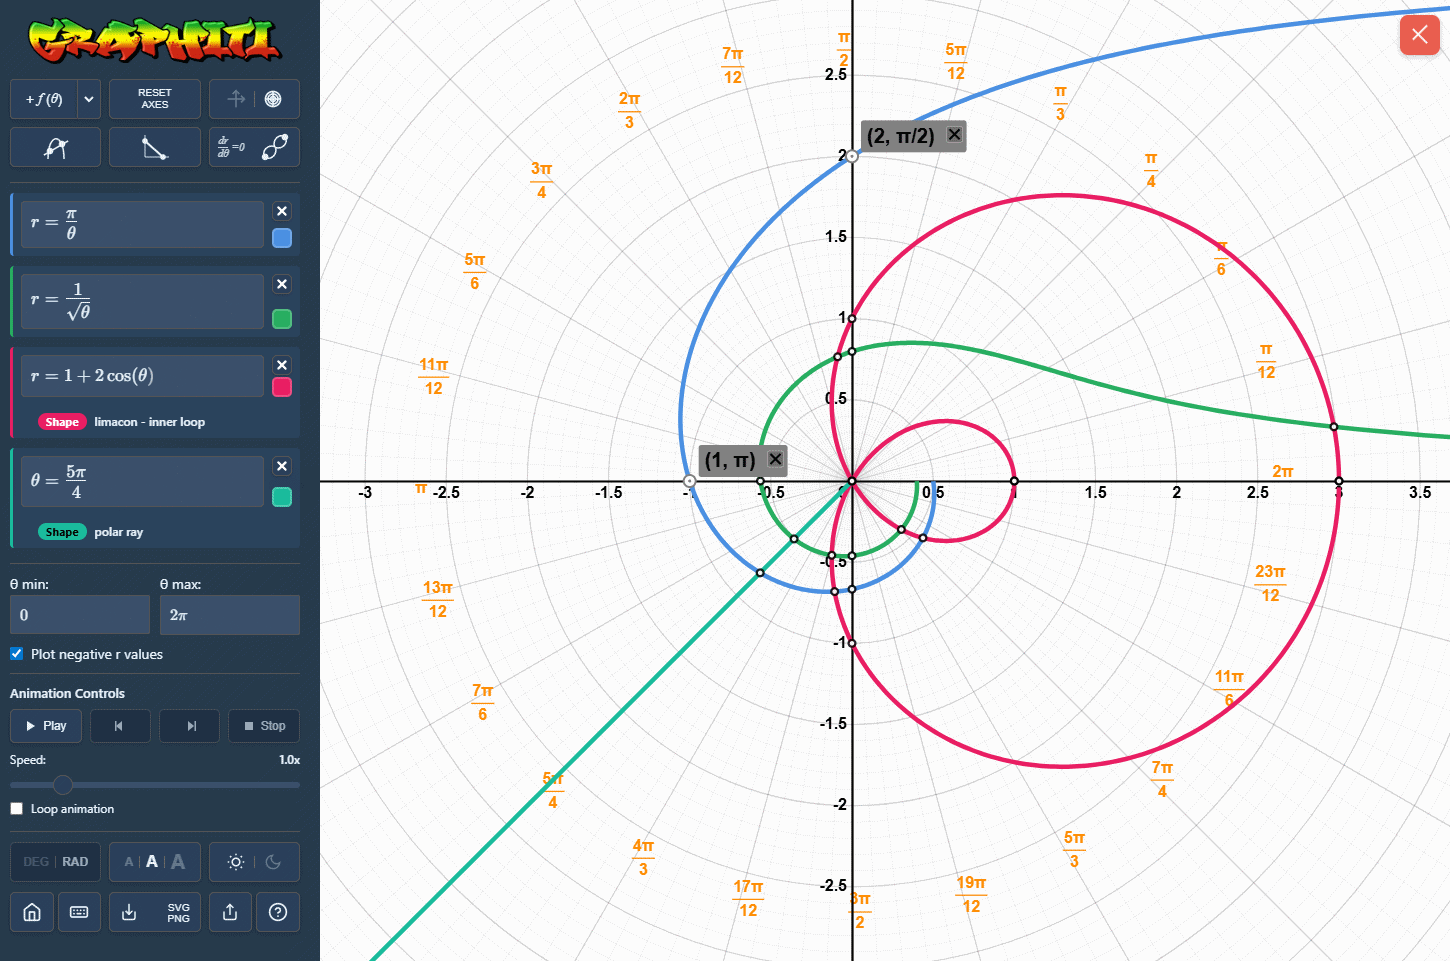
Polar equations describe points using a radius and angle, so the shape often depends on how the curve is traced through values of \(\theta\). Graphiti includes controls for the theta range, whether negative \(r\) values are plotted, and how the curve is animated.
- Plot explicit polar equations such as \(r = 2\cos(3\theta)\), \(r = 1 + \cos(\theta)\) and \(r = \theta\).
- Plot implicit polar equations such as \(r - \frac{\theta}{r} = 0\) and \(\frac{r-(1+\cos(\theta))}{\theta-\pi/3}=0\).
- Recognise named curves such as rose curves, cardioids, limacons, lemniscates of Bernoulli, logarithmic spirals, hyperbolic spirals, Fermat spirals, lituus, conchoid of Nicomedes and sinusoidal spirals.
- Identify rose curve petal counts when the visible range supports it.
- Distinguish limacon variants including inner loop and convex forms.
- Switch negative \(r\) plotting on or off to match different exam question conventions.
Animation and step-through
The animation tools are useful for teaching because students can watch the curve build up as \(\theta\) changes. Step-through controls make it easier to pause at important angles, compare the current point with the final shape, and explain why the curve crosses or loops back on itself.
This is especially helpful for rose curves, limacons, lemniscates and spirals, where the finished graph can hide the route taken by the polar parameter.