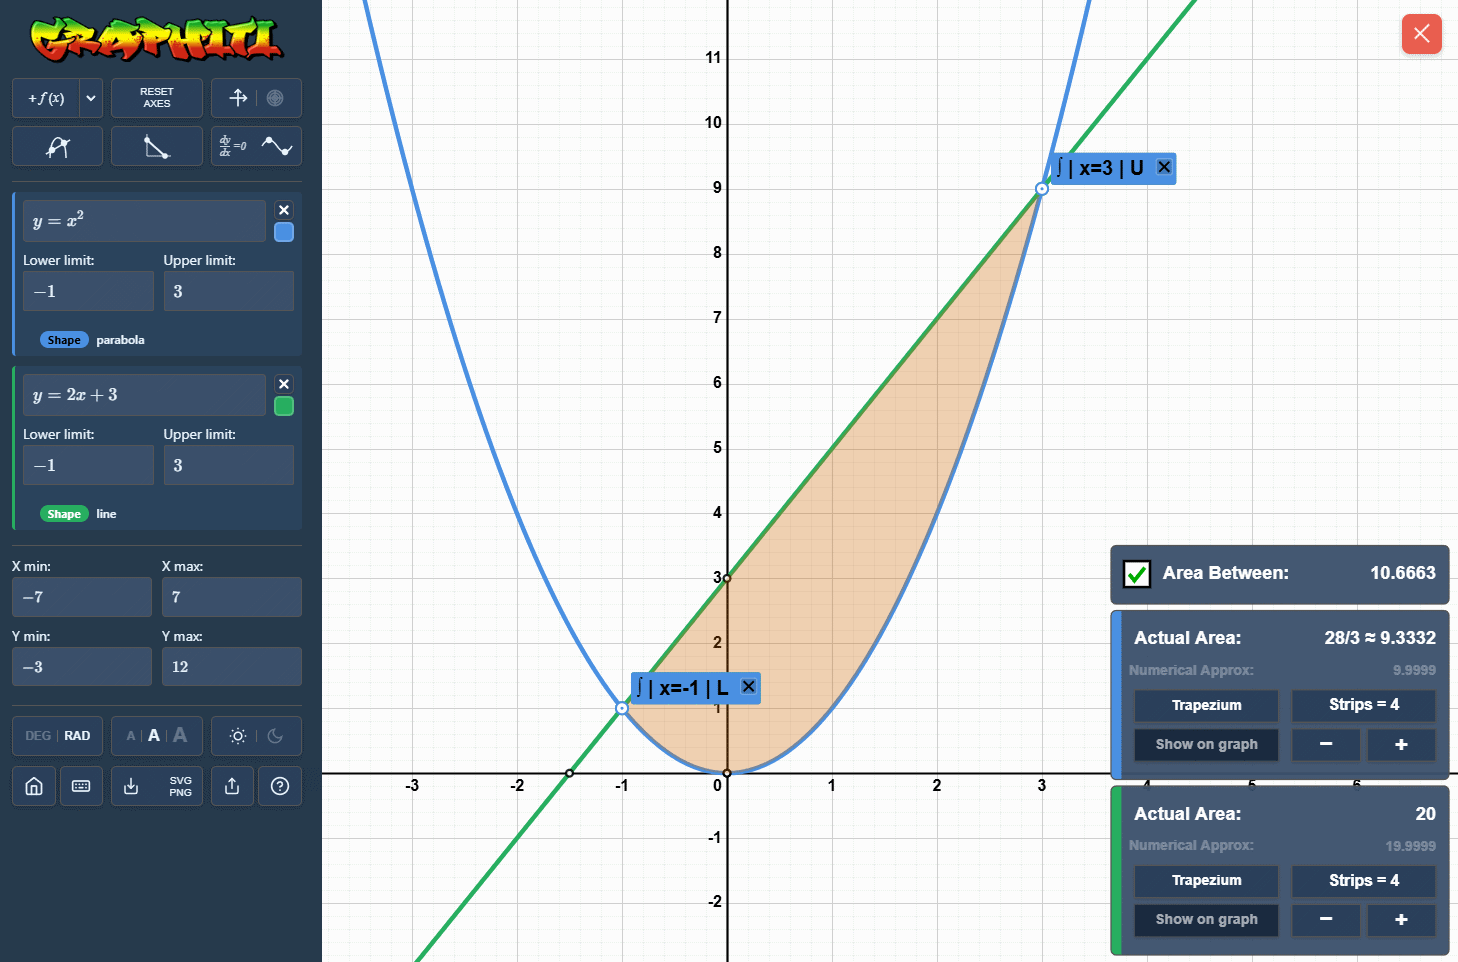
Definite integration
For exact definite integral work, Graphiti can mark limits and shade the area under the curve. The visual region helps students check which part of the graph is being accumulated.
- Show definite integral regions between selected limits.
- Connect the symbolic limits with the shaded region on the graph.
Numerical integration
Graphiti can also visualise numerical integration. Students can adjust the number of strips and compare the trapezium rule, Simpson's rule and the mid-ordinate rule on the same function.
This is useful for A-Level Maths examples where the focus is approximation, error, strip width and how a method changes as the number of strips increases.
Area between curves
Graphiti can shade the region between two curves and calculate the enclosed area over selected limits. This is useful when comparing functions, finding intersection-bounded regions, and checking which curve forms the upper or lower boundary.