What implicit plotting adds
Implicit equations let x and y appear together in one relation, such as \(x^2 + y^2 = 25\). That makes them ideal for graphing conic sections, curves with vertical parts, multiple branches and relations where solving for y would hide important behaviour.
- Plot equations involving both x and y.
- Graph standard conics including circles, ellipses, parabolas and hyperbolas.
- Show curves with vertical sections or multiple branches.
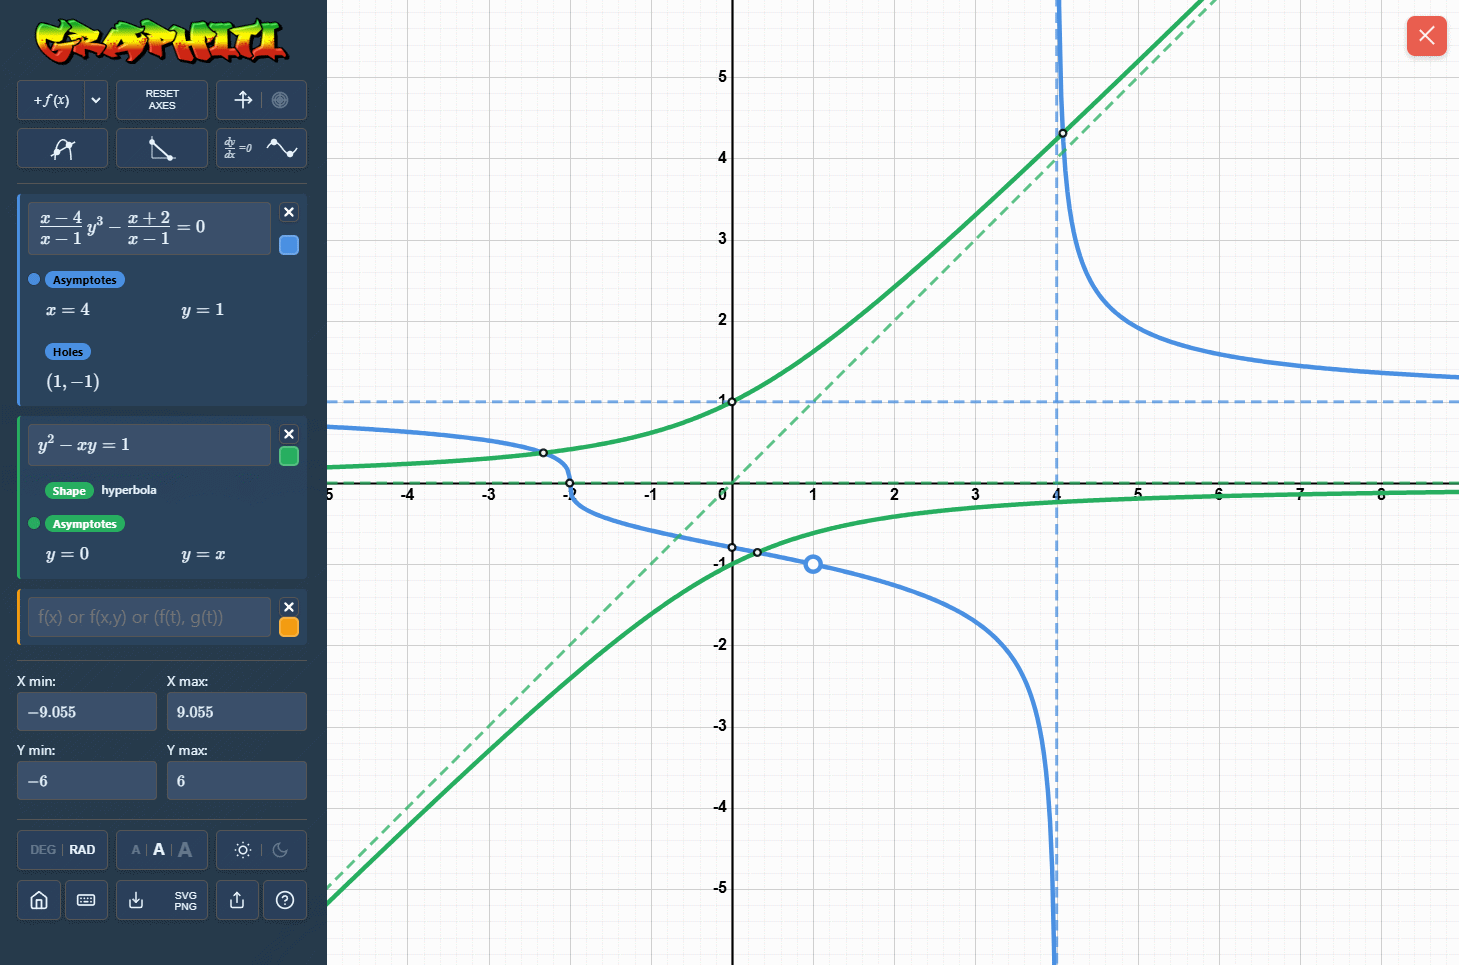
- Detect asymptotes for suitable implicit curves, including hyperbolas.
- Support A-Level Maths and Further Maths curve sketching and conics work.
Why it helps
Many important curves in A-Level and Further Maths are naturally written as relations rather than explicit functions. Plotting them directly helps students see the whole shape instead of working through several rearranged branches.
For conics, this means the familiar equations produce the expected geometric shapes quickly. For hyperbolas and other curves with asymptotic behaviour, Graphiti can also help connect the plotted curve with the asymptotes that structure it.