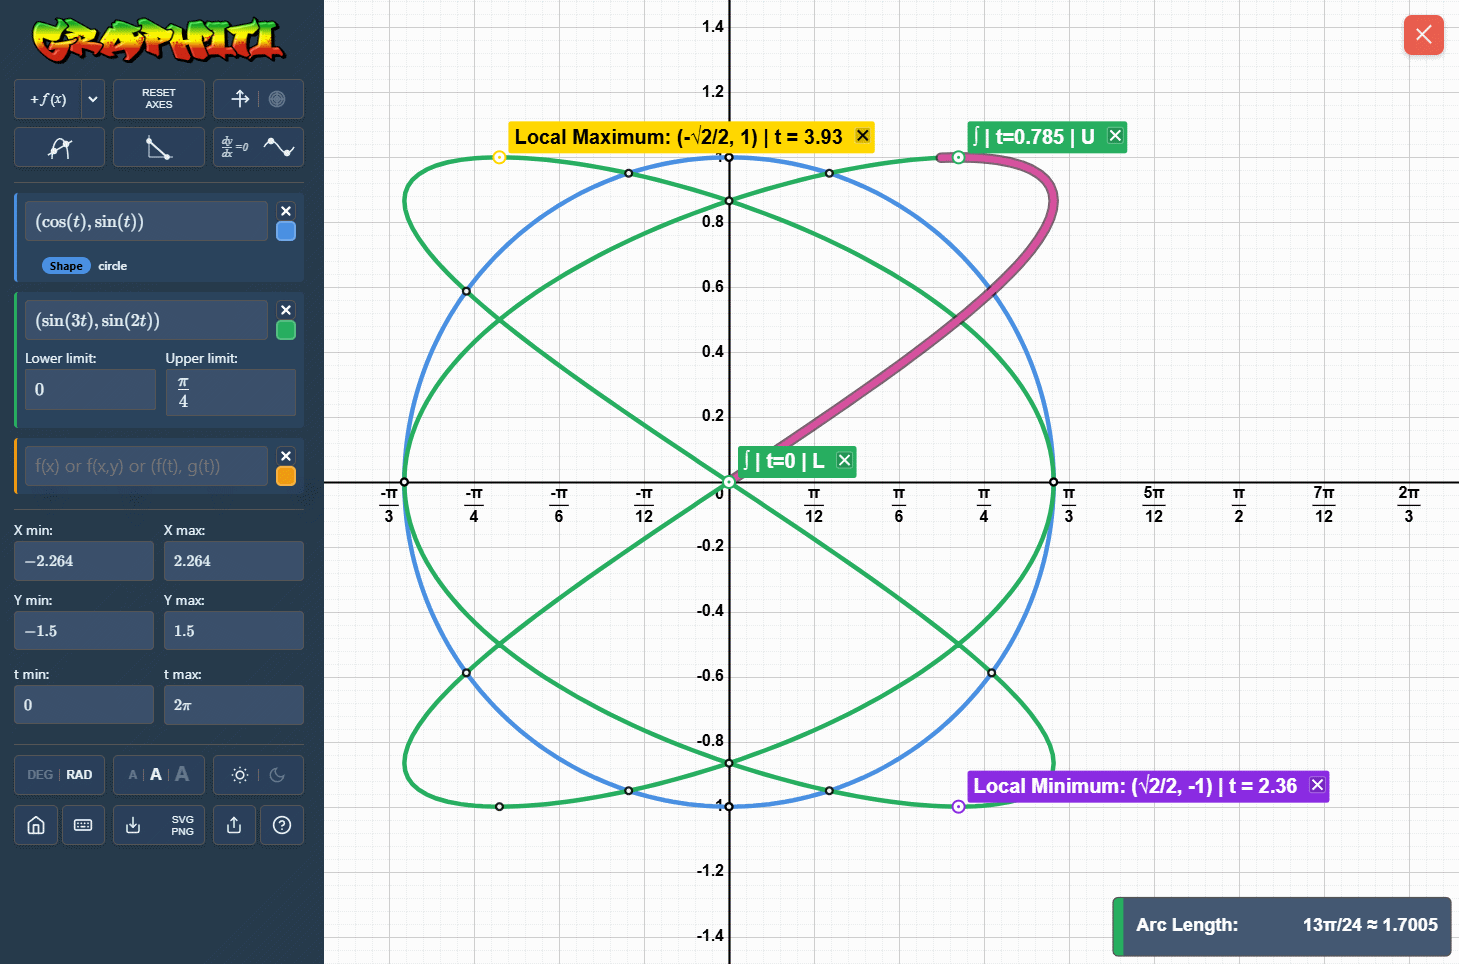
What parametric plotting adds
Parametric equations describe a curve using a parameter, often written as \(t\). Instead of solving directly for \(y\), the curve is built from coordinate pairs such as \((x(t), y(t))\).
- Plot coordinate pairs defined by \(x(t)\) and \(y(t)\).
- Graph ellipses such as \((2\cos(t), \sin(t))\).
- Explore Lissajous-style curves such as \((\sin(3t), \sin(2t))\).
- Support A-Level Maths and Further Maths parametric curve sketching.
Why it helps
Parametric form is often the natural way to express motion, loops and curves that are awkward to describe as a single function. It makes the relationship between position and parameter explicit.
For teaching, this helps students connect the algebraic pair \((x(t), y(t))\) with the plotted curve and compare how changing each component affects the final shape.